
Instruments 入門:用 Xcode 內建工具揪出效能與記憶體問題
寫代碼時,我們時常需要借助工具來分析問題、定位瓶頸,才能達到調優的目的。在 iOS 開發上,Xcode 附帶的 Instruments 就是這樣一套利器。
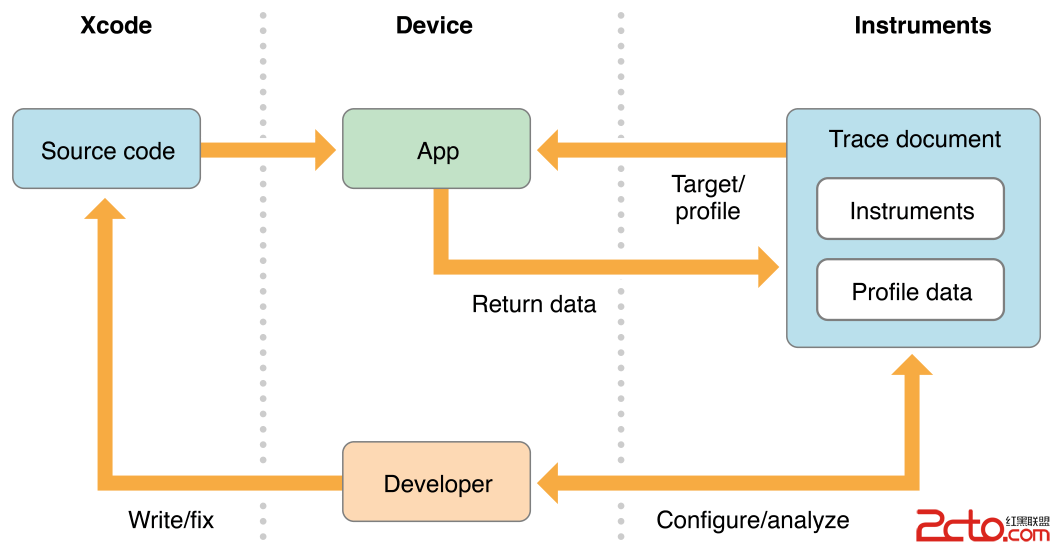
Instruments is a powerful and flexible performance-analysis and testing tool that's part of the Xcode tool set. It's designed to help you profile your OS X and iOS apps, processes, and devices in order to better understand and optimize their behavior and performance. Incorporating Instruments into your workflow from the beginning of the app development process can save you time later by helping you find issues early in the development cycle.
蘋果這段說明的重點是:越早把 Instruments 放進開發流程,越能在早期發現問題、節省後期的時間。本文介紹 Instruments 的整體樣貌,以及幾個最常使用的檢測工具。
怎麼打開 Instruments
三種常見方式:在 Xcode 選單中選擇 Open Developer Tool → Instruments;或在專案中選 Product → Profile(快捷鍵 Command-I)後選擇模板;也可以直接在 Xcode 工具列點 Run 旁邊的 Profile 按鈕。
打開後選擇要檢測的項目與對應的模板即可。
Core Animation
The Core Animation instrument captures information on selected animation statistics. It can record information from a single process or from all processes running on the system.
使用 Core Animation 模板有一個前提:必須真機檢測,模擬器上抓不到有意義的數據。

幾個最值得開啟的調色選項:

Color Blended Layers(圖層混合):把需要混合的圖層標成紅色。所謂 Blended Layer 是因為這些 layer 帶有透明度,系統渲染時必須把它與下層內容混合才能算出最終顏色,開銷較大。紅色越少越好。
Color Hits Green and Misses Red(圖層緩存):陰影、遮罩、漸層等會讓繪製成本變高,UIKit 提供 [layer setShouldRasterize:YES] 把這些 layer 快取成點陣圖重複使用,失效時再重建。命中快取的顯示綠色,未命中的顯示紅色,綠多紅少。
Color Offscreen-Rendered Yellow(離屏渲染):顯示一個視圖時,若需要先由 CPU 在後台算出點陣圖再交給 GPU 上屏,就稱為離屏渲染。一個畫面算兩次,圖形效能自然下降。黃色越少越好。
Color Misaligned Images(圖片縮放):當要繪製的點無法直接對應到螢幕上的實體像素時,系統必須對相鄰像素做反鋸齒計算,增加負擔。這類問題通常出在對 view 的 frame 做非整數計算與設定時。
Color Copied images:標記被 Core Animation 複製過的圖片。
Color Immediately:在 color-flush 操作中取消 10 毫秒延時。
Color Compositing Fast-Path Blue:標記由 GPU 硬體繪製的路徑。
Flash Updated Regions:閃示重繪區域。
後這幾項對圖形效能的分析意義有限,通常僅作參考。
Time Profiler
The Time Profiler instrument captures stack trace information at prescribed intervals. It can record information from a single process or from all processes running on the system.

Call Tree 的設定選項說明:
- Separate by Thread:按執行緒分開統計,才能揪出那些吃 CPU 的「重」執行緒。
- Invert Call Tree:把堆棧上下顛倒,讓最上層(呼叫層級最深)的方法排在最前面,通常這正是你想看的。
- Hide Missing Symbols:找不到 dSYM 時畫面上只會是十六進位位址,勾選後可隱藏這些雜訊。
- Hide System Libraries:只顯示自己的代碼。你關心的通常是自己寫的代碼花了多少時間,勾了它視野會乾淨很多。
- Show Obj-C Only:只顯示 Objective-C 代碼。若專案含有大量 C/C++(例如 OpenGL 相關),就不要勾。
- Flatten Recursion:把遞歸函數的每一層堆棧攤平成獨立條目。

列表中可以看到每個方法的耗時佔比。雙擊某個方法即可看到完整的堆疊與執行時間:

Leaks
The Leaks instrument captures information about leaked memory. It can record information from a single process only.

Leaks 那一列出現紅色標記,代表有記憶體洩漏。排查方式:先按左上角暫停程式,把下方詳情切到 Call Tree,並勾選 Invert Call Tree 與 Hide System Libraries,就能直接看到洩漏對應的呼叫路徑。

雙擊相關函數會直接跳到出問題的代碼位置,方便你逐行修正。

除了這三個模板,實務上 Allocations(追蹤記憶體配置與暫時佔用)、Allocations + Mark Generation(比對某段操作前後的物件增量)以及 Energy Log(電力消耗)也非常常用。建議把 Profile 變成日常開發的一部分,問題越早發現,成本越低。
- 上一篇文章: iOS 學習筆記 22:本地與遠程推送通知全解析
- 下一篇文章: iOS 常見錯誤與警告速查:10 個錯誤 + 6 個警告