
iOS 手繪折線圖:用 Core Graphics 打造可互動的雙資料曲線
編輯:iOS 開發綜合
想畫一張能點擊數值、支援雙組資料對比的折線圖,不一定非得引入第三方圖表庫。透過 drawRect: 搭配 Core Graphics,幾百行就能做出效果不錯的成品。
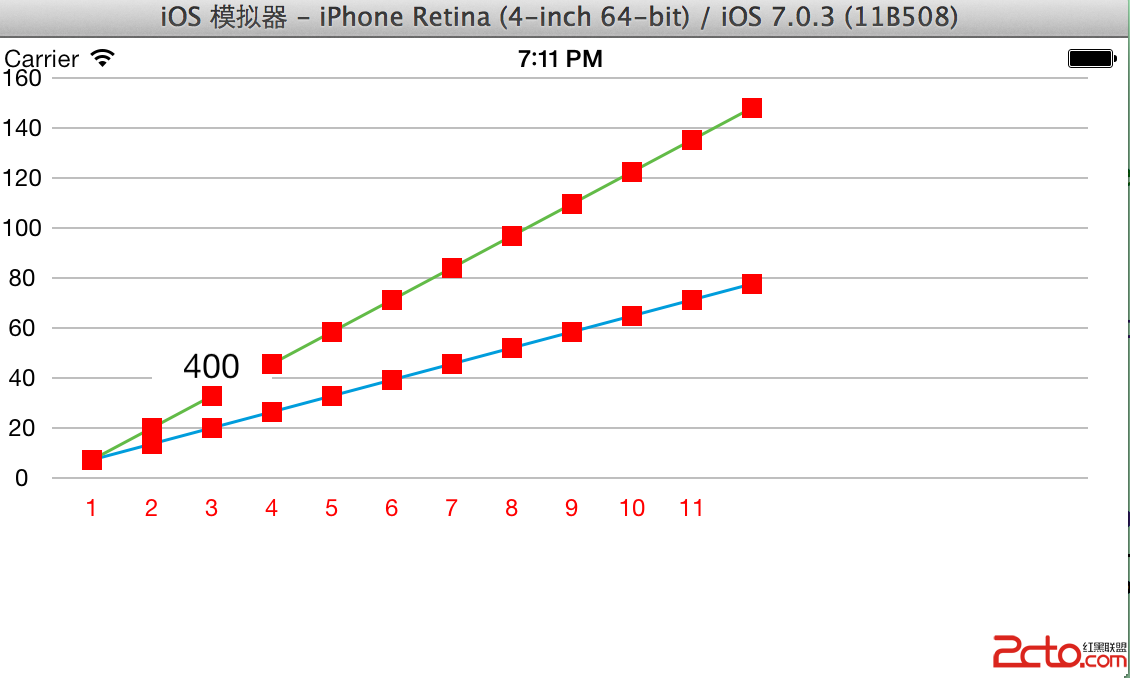
對外介面設計
LineChartViewDemo.h 只暴露四項必要設定:刻度間距、兩軸標籤,以及兩組折線資料。
#import <UIKit/UIKit.h>

@interface LineChartViewDemo : UIView

// 橫軸與縱軸的間距
@property (assign) NSInteger hInterval;
@property (assign) NSInteger vInterval;

// 兩軸顯示的標籤文字
@property (nonatomic, strong) NSArray *hDesc;
@property (nonatomic, strong) NSArray *vDesc;

// 兩組折線的點座標
@property (nonatomic, strong) NSArray *array;
@property (nonatomic, strong) NSArray *array1;

@end
核心繪製邏輯
LineChartViewDemo.m 分成三段:初始化時建立提示用的浮動視窗,drawRect: 畫背景格線與折線,最後由 btAction: 處理點擊提示。
#import "LineChartViewDemo.h"
#import "EColumnChartLabel.h"

#define KlineHeight 30

@interface LineChartViewDemo() {
    CALayer *linesLayer;
    UIView *popView;
    UILabel *disLabel;
    int x;
    int y;
}
@end

@implementation LineChartViewDemo

- (id)initWithFrame:(CGRect)frame {
    self = [super initWithFrame:frame];
    if (self) {
        self.backgroundColor = [UIColor clearColor];
        x = frame.size.width;
        y = frame.size.height;
        _hInterval = 10;
        _vInterval = 50;

        linesLayer = [[CALayer alloc] init];
        linesLayer.masksToBounds = YES;
        linesLayer.contentsGravity = kCAGravityLeft;
        linesLayer.backgroundColor = [[UIColor redColor] CGColor];

        // 點擊後浮現數值的提示框,初始隱藏
        popView = [[UIView alloc] initWithFrame:CGRectMake(0, 0, 60, 30)];
        [popView setBackgroundColor:[UIColor whiteColor]];
        [popView setAlpha:0.0f];
        disLabel = [[UILabel alloc] initWithFrame:popView.frame];
        [disLabel setTextAlignment:NSTextAlignmentCenter];
        [popView addSubview:disLabel];
        [self addSubview:popView];
    }
    return self;
}

- (void)drawRect:(CGRect)rect {
    [self setClearsContextBeforeDrawing:YES];
    CGContextRef context = UIGraphicsGetCurrentContext();

    // ---------- 先畫背景格線與縱軸標籤 ----------
    CGFloat backLineWidth = 0.5f;
    CGContextSetLineWidth(context, backLineWidth);
    CGContextSetLineJoin(context, kCGLineJoinRound);
    CGContextSetLineCap(context, kCGLineCapRound);
    CGContextSetBlendMode(context, kCGBlendModeNormal);
    CGContextSetStrokeColorWithColor(context,
        [UIColor colorWithRed:225.0f/255.0f green:225.0f/255.0f
                        blue:225.0f/255.0f alpha:1.0].CGColor);

    int tempY = y;
    for (int i = 0; i < _vDesc.count; i++) {
        CGPoint bPoint = CGPointMake(30, tempY);
        CGPoint ePoint = CGPointMake(x, tempY);

        EColumnChartLabel *label = [[EColumnChartLabel alloc]
                                    initWithFrame:CGRectMake(0, 0, 30, 30)];
        [label setCenter:CGPointMake(bPoint.x - 15, bPoint.y - 30)];
        [label setTextAlignment:NSTextAlignmentCenter];
        [label setBackgroundColor:[UIColor clearColor]];
        [label setTextColor:[UIColor blackColor]];
        [label setText:[_vDesc objectAtIndex:i]];
        [self addSubview:label];

        CGContextMoveToPoint(context, bPoint.x, bPoint.y - 30);
        CGContextAddLineToPoint(context, ePoint.x, ePoint.y - 30);
        tempY -= y * 0.1;
    }

    // 橫軸標籤
    for (int i = 0; i < _array.count - 1; i++) {
        EColumnChartLabel *label = [[EColumnChartLabel alloc]
            initWithFrame:CGRectMake(i * KlineHeight + 30, y - 30, 40, 30)];
        [label setTextAlignment:NSTextAlignmentCenter];
        [label setBackgroundColor:[UIColor clearColor]];
        [label setTextColor:[UIColor redColor]];
        label.numberOfLines = 1;
        label.adjustsFontSizeToFitWidth = YES;
        label.minimumFontSize = 1.0f;
        [label setText:[_hDesc objectAtIndex:i]];
        [self addSubview:label];
    }
    CGContextStrokePath(context);

    // ---------- 畫第一組折線(去年) ----------
    CGFloat pointLineWidth = 1.5f;
    CGContextSetLineWidth(context, pointLineWidth);
    CGContextSetMiterLimit(context, 5.0f);
    CGContextSetLineJoin(context, kCGLineJoinRound);
    CGContextSetLineCap(context, kCGLineCapRound);
    CGContextSetBlendMode(context, kCGBlendModeNormal);

    int tempWidth = y * 0.1f;
    float tempHeight  = y * (270.0 / 320.0);
    float tempHeight1 = y * (20.0f / 320.0f);

    [c_BeforeLastYear set];

    CGPoint p1 = [[_array objectAtIndex:0] CGPointValue];
    CGContextMoveToPoint(context, p1.x + 20, tempHeight - p1.y * tempWidth / tempHeight1);

    for (int i = 0; i < [_array count]; i++) {
        p1 = [[_array objectAtIndex:i] CGPointValue];
        CGPoint goPoint = CGPointMake(p1.x + 20, tempHeight - p1.y * tempWidth / tempHeight1);
        CGContextAddLineToPoint(context, goPoint.x, goPoint.y);

        // 每個點上放一顆可點擊的按鈕
        UIButton *bt = [UIButton buttonWithType:UIButtonTypeCustom];
        [bt setBackgroundColor:[UIColor redColor]];
        [bt setFrame:CGRectMake(0, 0, 10, 10)];
        [bt setCenter:goPoint];
        [bt addTarget:self action:@selector(btAction:)
     forControlEvents:UIControlEventTouchUpInside];
        [self addSubview:bt];
    }
    CGContextStrokePath(context);

    // ---------- 畫第二組折線(今年) ----------
    [c_LastYear set];

    p1 = [[_array1 objectAtIndex:0] CGPointValue];
    CGContextMoveToPoint(context, p1.x + 20, tempHeight - p1.y * tempWidth / tempHeight1);

    for (int i = 0; i < [_array1 count]; i++) {
        p1 = [[_array1 objectAtIndex:i] CGPointValue];
        CGPoint goPoint = CGPointMake(p1.x + 20, tempHeight - p1.y * tempWidth / tempHeight1);
        CGContextAddLineToPoint(context, goPoint.x, goPoint.y);

        UIButton *bt = [UIButton buttonWithType:UIButtonTypeCustom];
        [bt setBackgroundColor:[UIColor redColor]];
        [bt setFrame:CGRectMake(0, 0, 10, 10)];
        [bt setCenter:goPoint];
        [bt addTarget:self action:@selector(btAction:)
     forControlEvents:UIControlEventTouchUpInside];
        [self addSubview:bt];
    }
    CGContextStrokePath(context);
}

// 點擊任一資料點,讓提示框浮現並對齊該點
- (void)btAction:(id)sender {
    [disLabel setText:@"400"];
    UIButton *bt = (UIButton *)sender;
    popView.center = CGPointMake(bt.center.x,
                                 bt.center.y - popView.frame.size.height / 2);
    [popView setAlpha:1.0f];
}

@end
在檢視控制器中產生資料
#import "ViewController.h"
#import "LineChartViewDemo.h"

#define KlineHeight 20
#define KlineWidth  30

@implementation ViewController

- (void)viewDidLoad {
    [super viewDidLoad];

    LineChartViewDemo *line = [[LineChartViewDemo alloc]
                               initWithFrame:CGRectMake(0, 0, 548, 250)];

    // 第一組點:斜率較緩
    NSMutableArray *pointArr = [[NSMutableArray alloc] init];
    for (int i = 0; i < 12; i++) {
        [pointArr addObject:[NSValue valueWithCGPoint:CGPointMake(KlineWidth * (i + 1), 5 * i)]];
    }

    // 第二組點:斜率較陡,用於對比
    NSMutableArray *pointArr2 = [NSMutableArray array];
    for (int i = 0; i < 12; i++) {
        [pointArr2 addObject:[NSValue valueWithCGPoint:CGPointMake(KlineWidth * (i + 1), 10 * i)]];
    }

    // 縱軸標籤
    NSMutableArray *vArr = [[NSMutableArray alloc] initWithCapacity:pointArr.count - 1];
    for (int i = 0; i < 9; i++) {
        [vArr addObject:[NSString stringWithFormat:@"%d", i * 20]];
    }

    // 橫軸標籤
    NSMutableArray *hArr = [[NSMutableArray alloc] initWithCapacity:pointArr.count - 1];
    for (int i = 1; i <= 12; i++) {
        [hArr addObject:[NSString stringWithFormat:@"%d", i]];
    }

    [line setHDesc:hArr];
    [line setVDesc:vArr];
    [line setArray:pointArr];
    [line setArray1:pointArr2];
    [self.view addSubview:line];
}

@end
實作上的幾點提醒
- 折線的 y 座標換算涉及「資料值 → 像素」的映射,範例中的
tempHeight、tempWidth、tempHeight1是依設計稿比例硬寫出來的,實際專案應改為依vDesc的最大最小值動態計算,才能換資料不換程式碼。 - 在
drawRect:裡呼叫addSubview:建立按鈕並不合適。每次重繪都會新增一批子視圖,效能與記憶體都會受影響。較好的做法是在初始化時一次建好,或改用touchesBegan:自行做命中測試。 CGContextStrokePath會清空目前路徑,因此「畫格線 → stroke → 畫折線 → stroke」的順序是必要的,兩段之間不要混用。- 為避免鋸齒,1 像素線寬建議對齊到 0.5 的座標位置。