
FBMemoryProfiler 快速上手:從安裝到誤報過濾
FBMemoryProfiler 是 Facebook 開源的 iOS 記憶體分析工具集,既能檢視記憶體用量,也能揪出循環引用(retain cycle)。
官方稍前發表過一篇《在 iOS 上自動偵測記憶體洩漏》,把背後的原理講得很透徹。由於不少讀者在留言中詢問實際怎麼用,這篇就補上一份操作導引。
安裝
CocoaPods
最省力的做法是 CocoaPods,在 Podfile 裡補一行即可:
pod 'FBMemoryProfiler'
需要注意的是,FBMemoryProfiler 最低支援 iOS 8。若你的 Podfile 把平台鎖在 iOS 6 或 7,是裝不起來的。實務上的建議是只在開發用的 target 引入它,正式打包的 target 保持乾淨。
我自己的習慣是維護兩個 target:一個開發用,裡頭放 Reveal、蒲公英這類只在除錯時才需要的庫;另一個專門產出正式包。於是 Podfile 大致長這樣:
# Uncomment this line to define a global platform for your project platform :ios, '8.0' # Uncomment this line if you're using Swift # use_frameworks! target 'FBMemoryProfilerTest' do end target 'FBMemoryProfilerTest_Dev' do pod 'FBMemoryProfiler' end
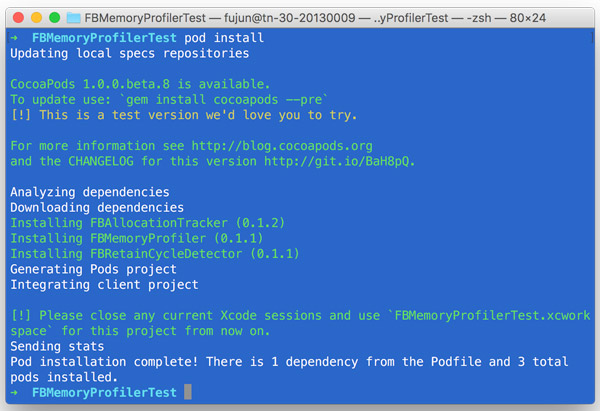
安裝成功後,記得改用對應的 .xcworkspace 開啟專案。
Carthage
如果你的 App 從 iOS 8 起才支援,也可以走 Carthage。在 Cartfile 中加入:
github "facebook/FBMemoryProfiler"
接著執行 carthage update --configuration Debug 即可。我的專案需要向下相容到 iOS 6,所以沒走這條路。
嵌入程式碼
第一步是在 main.m 裡掛上 FBRetainCycleDetector 的 hook,同時開啟 FBAllocationTracker 的追蹤與世代記錄:
#import#import "AppDelegate.h" #if DEBUG #import #import #endif int main(int argc, char * argv[]) { @autoreleasepool { #if DEBUG [FBAssociationManager hook]; [[FBAllocationTrackerManager sharedManager] startTrackingAllocations]; [[FBAllocationTrackerManager sharedManager] enableGenerations]; #endif return UIApplicationMain(argc, argv, nil, NSStringFromClass([AppDelegate class])); } }
我習慣加上 DEBUG 判斷,只在除錯環境啟用;這一步並非必要,端看個人偏好。
接著在 AppDelegate.m 的 application: didFinishLaunchingWithOptions: 中建立 FBMemoryProfiler 實例:
#if DEBUG #import#import #import "CacheCleanerPlugin.h" #import "RetainCycleLoggerPlugin.h" #endif @interface AppDelegate () { #if DEBUG FBMemoryProfiler *memoryProfiler; #endif } @end @implementation AppDelegate - (BOOL)application:(UIApplication *)application didFinishLaunchingWithOptions:(NSDictionary *)launchOptions { #if DEBUG memoryProfiler = [[FBMemoryProfiler alloc] initWithPlugins:@[[CacheCleanerPlugin new], [RetainCycleLoggerPlugin new]] retainCycleDetectorConfiguration:nil]; [memoryProfiler enable]; #endif return YES; } @end
插件(plugin)是可選的。若你什麼都不傳,寫法可以精簡成:
FBMemoryProfiler *memoryProfiler = [FBMemoryProfiler new]; [memoryProfiler enable];
插件的價值在於過濾、去重,以及把結果輸出或保存。少了它,你只能盯著真機或模擬器上的畫面找出洩漏;有了自訂的日誌插件,捕到的循環引用就能寫進 console 或檔案。
舉例來說,自訂一個 RetainCycleLoggerPlugin,遵循 FBMemoryProfilerPluggable 協定並實作 memoryProfilerDidFindRetainCycles::
- (void)memoryProfilerDidFindRetainCycles:(NSSet *)retainCycles { if (retainCycles.count > 0) { NSLog(@"\nretainCycles = \n%@", retainCycles); } }當 FBRetainCycleDetector 找到循環引用時就會呼叫這個方法。由於傳入的 retainCycles 可能是空集合,記得先過濾一次。
把誤報過濾掉
我在測試自己的 App 時遇到過這樣的情況:
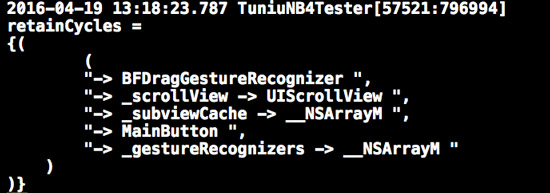
我很確定這個環不是我造成的,但 FBRetainCycleDetector 確實在這裡報了警。問題出在 _subviewCache,那是 Apple 自身的機制,並不會導致記憶體洩漏。這類誤報必須排除。
另一個常見的干擾源是 Timer。一般情況下 Timer 會強引用 target,確實存在洩漏風險;但如果你已確認用法沒問題,也可以選擇關閉對 Timer 的檢查。
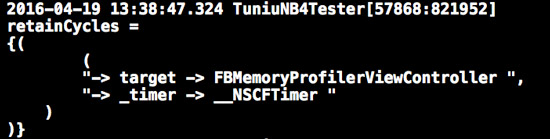
過濾的寫法大致如下:
NSArray *filters = @[FBFilterBlockWithObjectIvarRelation([UIView class], @"_subviewCache")]; FBObjectGraphConfiguration *configuration = [[FBObjectGraphConfiguration alloc] initWithFilterBlocks:filters shouldInspectTimers:YES]; memoryProfiler = [[FBMemoryProfiler alloc] initWithPlugins:@[[CacheCleanerPlugin new], [RetainCycleLoggerPlugin new]] retainCycleDetectorConfiguration:configuration]; [memoryProfiler enable];
原理很單純:準備一個過濾陣列,塞進 FBMemoryProfiler 的 configuration 裡即可。凡是確定無害、或暫時不打算處理的項目,都能在這裡排除。例如:
NSArray *filters = @[FBFilterBlockWithObjectIvarRelation([UIPanGestureRecognizer class], @"_internalActiveTouches")];
若有 CI 需求,可以在 delegate 中把日誌寫成文字檔,再回傳到伺服器端彙整。
執行
實際操作可以參考 Facebook 的示範影片,前一篇譯文中也附上了連結。
範例程式碼
上述內容都整理在這個 demo 裡:https://github.com/Forkong/FBMemoryProfilerDemo。clone 下來後先執行 pod install,才能正常運轉。
- 上一篇文章: Tips:LLDB 調試基礎入門
- 下一篇文章: 可複用、低耦合的 iOS 使用者行為統計方案