
iOS 繪製顏色漸變的動畫折線圖完整實作
折線圖能直觀地呈現數據變化,因此被廣泛應用於各類 App。網路上繪製折線圖的範例不少,但同時具備動畫效果與線條顏色漸變的實作卻相當罕見。本文將完整解析如何繪製一個帶有漸變色彩與動畫效果的折線圖。
先來看看最終效果:
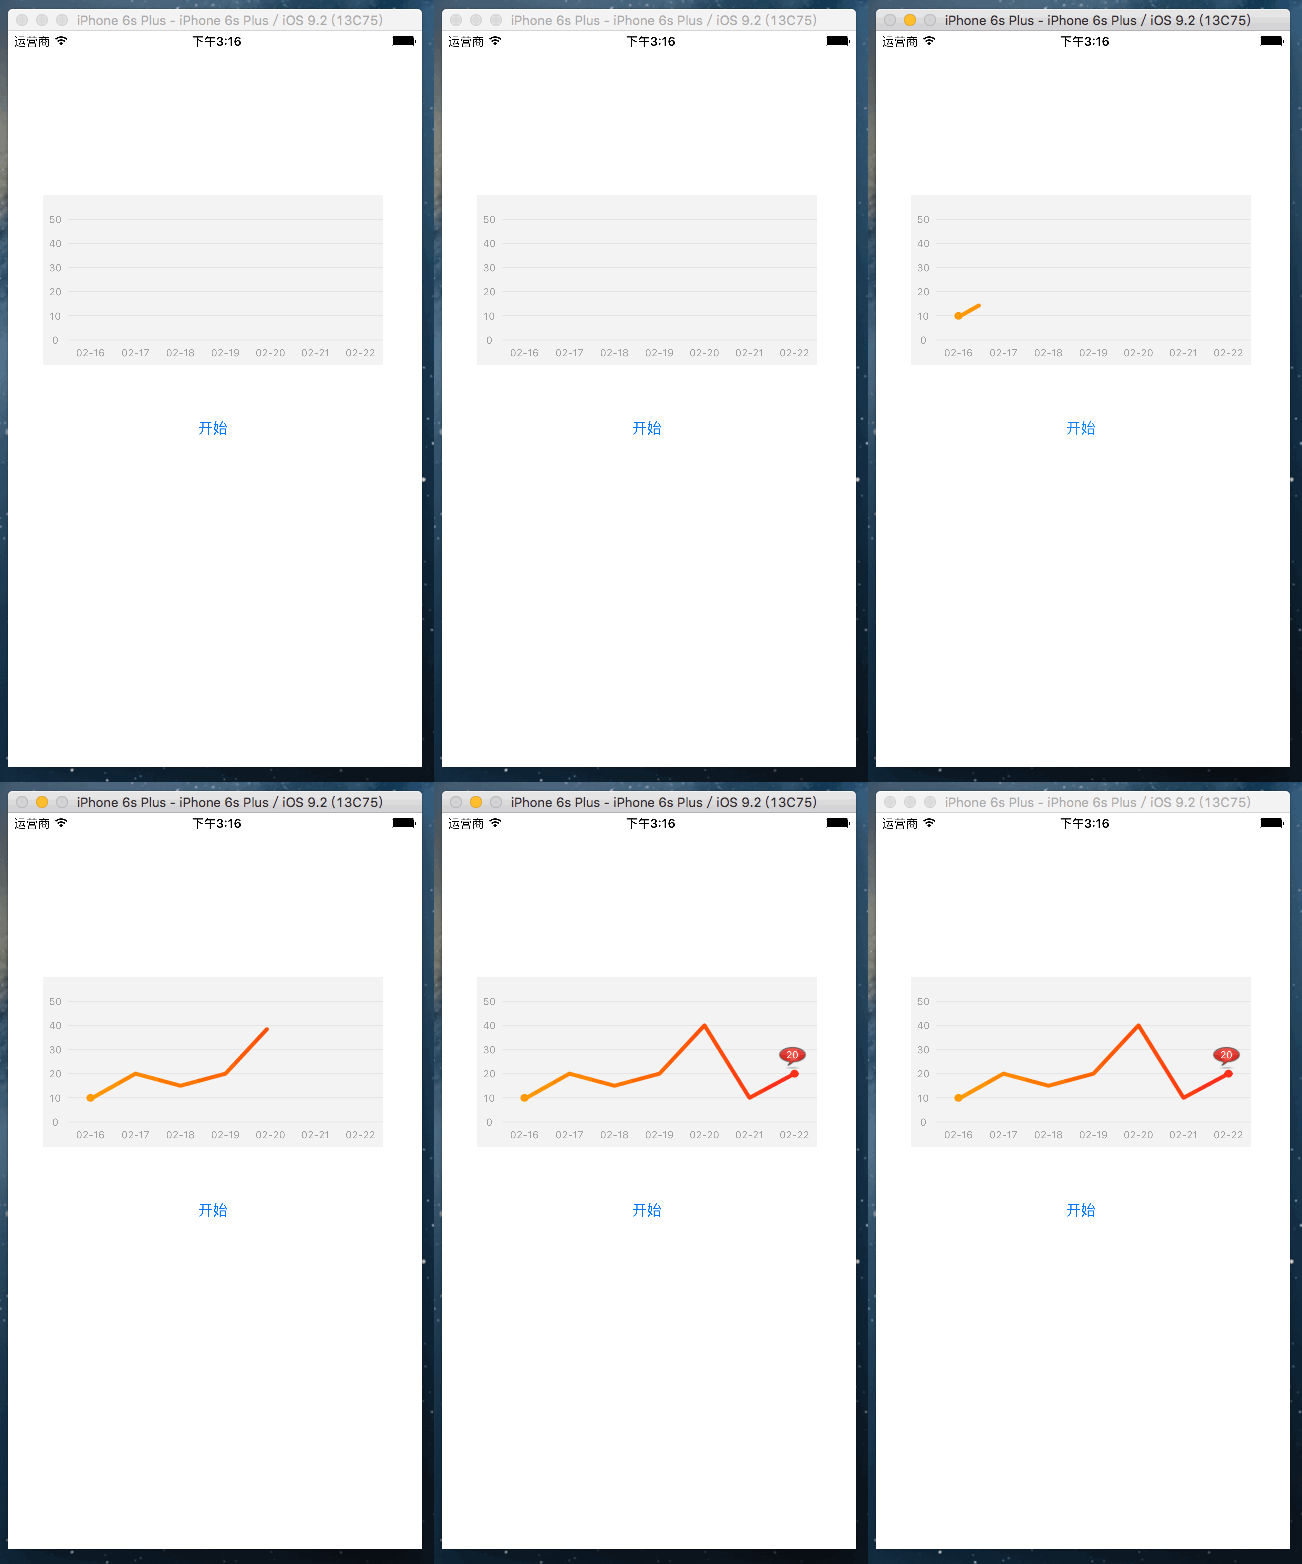
概述
為增強使用者體驗,很多應用都嵌入了折線圖。本文闡述了動畫繪製「線條顏色漸變」折線圖的完整方案與原理。最終成品已被封裝成一個 UIView 子類並提供相應接口,大部分需要折線圖的專案都可以直接拖入使用;若需求有差異,也可依本文思路自行定義。
涉及的知識點
CALayer:圖層,可簡單理解為不接受使用者互動的 UIView,每個圖層都有類似蒙版的 mask 屬性。本文主要用到 CAGradientLayer(繪製漸變背景)與 CAShapeLayer(繪製折線)。
CAAnimation:核心動畫的基類,用來實現動畫操作。
Quartz 2D:二維繪圖引擎,用來繪製折線(Path)與座標軸文字(Text)。
實現思路
線條顏色漸變的關鍵
一開始我嘗試改變路徑 UIBezierPath 的 strokeColor,但 strokeColor 只能設定一種顏色,無法實現漸變。最終找到的解法是善用 CALayer 的 mask 屬性:建立一個 UIView 封裝漸變背景,在其上加入 CAGradientLayer;再建立一個 CAShapeLayer 用來繪製線條(strokeColor 設為白色、fillColor 設為透明),並將它設為背景視圖的 mask。如此一來,線條便會「透」出底層漸變圖層的顏色。
折線繪製
使用 UIBezierPath 繪製折線,轉折處以 kCALineCapRound 與 kCALineJoinRound 設為圓角;起點與終點則直接在路徑上加一個半徑為線寬一半的圓,確保呈現實心圓點。
動畫
使用 CABasicAnimation 完成繪製動畫。注意折線路徑初始時需將線寬設為 0,開始繪製時再設為適當線寬,以確保初始狀態線條是隱藏的。
折線轉折點的資料結構
由於轉折點需要放進陣列中,因此用一個類別來描述,而非單純使用 CGPoint:
@interface IDLineChartPoint : NSObject
@property (nonatomic, assign) float x;
@property (nonatomic, assign) float y;
+ (instancetype)pointWithX:(float)x andY:(float)y;
@end
@implementation IDLineChartPoint
+ (instancetype)pointWithX:(float)x andY:(float)y {
    IDLineChartPoint *point = [[self alloc] init];
    point.x = x;
    point.y = y;
    return point;
}
@end
自訂折線圖視圖
@interface IDLineChartView : UIView
@property (nonatomic, strong) NSMutableArray<IDLineChartPoint *> *pointArray;
- (void)startDrawlineChart;
@end
@implementation IDLineChartView
- (instancetype)initWithFrame:(CGRect)frame {
    if (self = [super initWithFrame:frame]) {
        self.backgroundColor = [UIColor colorWithRed:243/255.0 green:243/255.0 blue:243/255.0 alpha:1.0];
    }
    return self;
}
@end
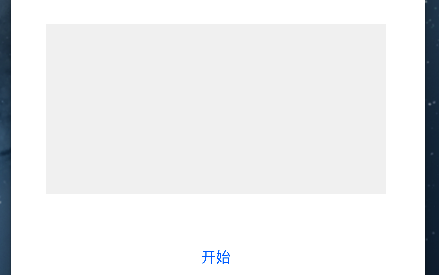
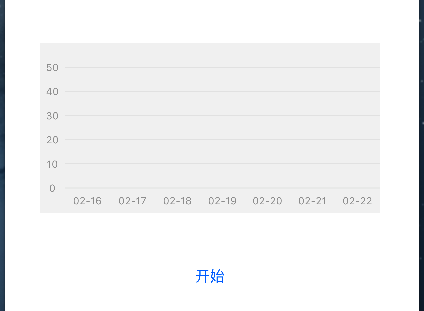
繪製座標軸
座標軸直接在 drawRect 中繪製,先定義相關常量與成員變數:
static const CGFloat kPadding = 25.0;
static const CGFloat kCoordinateLineWith = 1.0;
// X 軸與 Y 軸的單位長度、資訊陣列等成員變數略
X 軸顯示最近七天的日期,Y 軸顯示數據變化的幅度。繪製時透過 enumerateObjectsUsingBlock 逐一計算文字尺寸與起點,再呼叫 drawAtPoint 繪製;同時用 CGContext 畫出橫向標線:
- (void)drawRect:(CGRect)rect {
    CGContextRef context = UIGraphicsGetCurrentContext();
    // x 軸文字繪製...
    // y 軸文字與橫向標線繪製...
    CGContextSetRGBStrokeColor(context, 231/255.0, 231/255.0, 231/255.0, 1.0);
    CGContextSetLineWidth(context, kCoordinateLineWith);
    CGContextMoveToPoint(context, kPadding, self.bounds.size.height - kPadding);
    CGContextAddLineToPoint(context, self.bounds.size.width, self.bounds.size.height - kPadding);
    CGContextStrokePath(context);
}
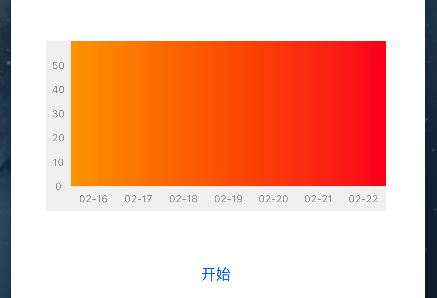
漸變背景視圖
- (void)drawGradientBackgroundView {
    // 漸變背景視圖(不含座標軸)
    self.gradientBackgroundView = [[UIView alloc] initWithFrame:CGRectMake(kPadding, 0, self.bounds.size.width - kPadding, self.bounds.size.height - kPadding)];
    [self addSubview:self.gradientBackgroundView];
    self.gradientLayer = [CAGradientLayer layer];
    self.gradientLayer.frame = self.gradientBackgroundView.bounds;
    self.gradientLayer.startPoint = CGPointMake(0, 0.0);
    self.gradientLayer.endPoint = CGPointMake(1.0, 0.0);
    self.gradientLayerColors = [NSMutableArray arrayWithArray:@[(__bridge id)[UIColor colorWithRed:253/255.0 green:164/255.0 blue:8/255.0 alpha:1.0].CGColor, (__bridge id)[UIColor colorWithRed:251/255.0 green:37/255.0 blue:45/255.0 alpha:1.0].CGColor]];
    self.gradientLayer.colors = self.gradientLayerColors;
    [self.gradientBackgroundView.layer addSublayer:self.gradientLayer];
}
折線圖層與蒙版
用 UIBezierPath 建立折線路徑,並在起點與終點加上圓點,最後將 CAShapeLayer 設為漸變背景圖層的 mask:
- (void)setupLineChartLayerAppearance {
    UIBezierPath *path = [UIBezierPath bezierPath];
    [self.pointArray enumerateObjectsUsingBlock:^(IDLineChartPoint * _Nonnull obj, NSUInteger idx, BOOL * _Nonnull stop) {
        if (idx == 0) {
            [path moveToPoint:CGPointMake(self.xAxisSpacing * 0.5 + (obj.x - 1) * self.xAxisSpacing, self.bounds.size.height - kPadding - obj.y * self.yAxisSpacing)];
        } else {
            [path addLineToPoint:CGPointMake(self.xAxisSpacing * 0.5 + (obj.x - 1) * self.xAxisSpacing, self.bounds.size.height - kPadding - obj.y * self.yAxisSpacing)];
        }
        if (idx == 0 || idx == self.pointArray.count - 1) {
            [path addArcWithCenter:CGPointMake(self.xAxisSpacing * 0.5 + (obj.x - 1) * self.xAxisSpacing, self.bounds.size.height - kPadding - obj.y * self.yAxisSpacing) radius:2.0 startAngle:0 endAngle:2 * M_PI clockwise:YES];
        }
    }];
    self.lineChartLayer = [CAShapeLayer layer];
    self.lineChartLayer.path = path.CGPath;
    self.lineChartLayer.strokeColor = [UIColor whiteColor].CGColor;
    self.lineChartLayer.fillColor = [[UIColor clearColor] CGColor];
    self.lineChartLayer.lineWidth = 0; // 初始隱藏
    self.lineChartLayer.lineCap = kCALineCapRound;
    self.lineChartLayer.lineJoin = kCALineJoinRound;
    self.gradientBackgroundView.layer.mask = self.lineChartLayer;
}
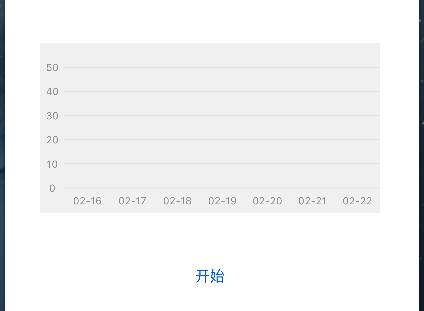
動畫的開始與結束
開始繪製時將線寬設為 4,並透過 strokeEnd 的 CABasicAnimation 讓折線逐步顯現:
- (void)startDrawlineChart {
    self.lineChartLayer.lineWidth = 4;
    if ([self.subviews containsObject:self.tapButton]) {
        [self.tapButton removeFromSuperview];
    }
    CABasicAnimation *pathAnimation = [CABasicAnimation animationWithKeyPath:@"strokeEnd"];
    pathAnimation.duration = 2.5;
    pathAnimation.repeatCount = 1;
    pathAnimation.removedOnCompletion = NO;
    pathAnimation.fromValue = [NSNumber numberWithFloat:0.0f];
    pathAnimation.toValue = [NSNumber numberWithFloat:1.0f];
    pathAnimation.delegate = self;
    [self.lineChartLayer addAnimation:pathAnimation forKey:@"strokeEnd"];
}
動畫結束時,透過 animationDidStop 在折線終點加上一個顯示數值的標籤:
- (void)animationDidStop:(CAAnimation *)anim finished:(BOOL)flag {
    if (self.tapButton == nil) {
        CGRect tapButtonFrame = CGRectMake(self.xAxisSpacing * 0.5 + ([self.pointArray[self.pointArray.count - 1] x] - 1) * self.xAxisSpacing + 8, self.bounds.size.height - kPadding - [self.pointArray[self.pointArray.count - 1] y] * self.yAxisSpacing - 34, 30, 30);
        self.tapButton = [[UIButton alloc] initWithFrame:tapButtonFrame];
        self.tapButton.enabled = NO;
        [self.tapButton setBackgroundImage:[UIImage imageNamed:@"bubble"] forState:UIControlStateDisabled];
        [self.tapButton.titleLabel setFont:[UIFont systemFontOfSize:10]];
        [self.tapButton setTitle:@"20" forState:UIControlStateDisabled];
    }
    [self addSubview:self.tapButton];
}
整合到專案
建立折線圖視圖並加入控制器,再建立一個「開始」按鈕觸發繪製動畫:
self.lineCharView = [[IDLineChartView alloc] initWithFrame:CGRectMake(35, 164, 340, 170)];
[self.view addSubview:self.lineCharView];

self.drawLineChartButton = [UIButton buttonWithType:UIButtonTypeSystem];
self.drawLineChartButton.frame = CGRectMake(180, 375, 50, 44);
[self.drawLineChartButton setTitle:@"開始" forState:UIControlStateNormal];
[self.drawLineChartButton addTarget:self action:@selector(drawLineChart) forControlEvents:UIControlEventTouchUpInside];
[self.view addSubview:self.drawLineChartButton];

- (void)drawLineChart {
    [self.lineCharView startDrawlineChart];
}
以上就是 iOS 繪製動畫漸變折線圖的完整流程。核心在於善用 CAGradientLayer 搭配 CAShapeLayer 的 mask 屬性來實現漸變,再用 CABasicAnimation 呈現動畫,希望對你有所幫助。
- 上一篇文章: iOS 呼叫相簿圖片與取得最新一張照片的實作
- 下一篇文章: 深入解析 Cocos2D 遊戲開發中的座標與錨點關係