
淺談 LLDB 調試器:命令結構與實戰技巧
隨著 Xcode 5 的發布,LLDB 調試器已取代 GDB,成為 Xcode 工程默認的調試器。它與 LLVM 編譯器一起,帶來更豐富的流程控制與數據檢測能力。LLDB 為 Xcode 提供了底層調試環境,其中包括內嵌在 Xcode IDE 中、位於調試區域的控制面板,我們可以在這裡直接調用 LLDB 命令,如圖 1 所示:
圖 1:位於 Xcode 調試區域的控制台
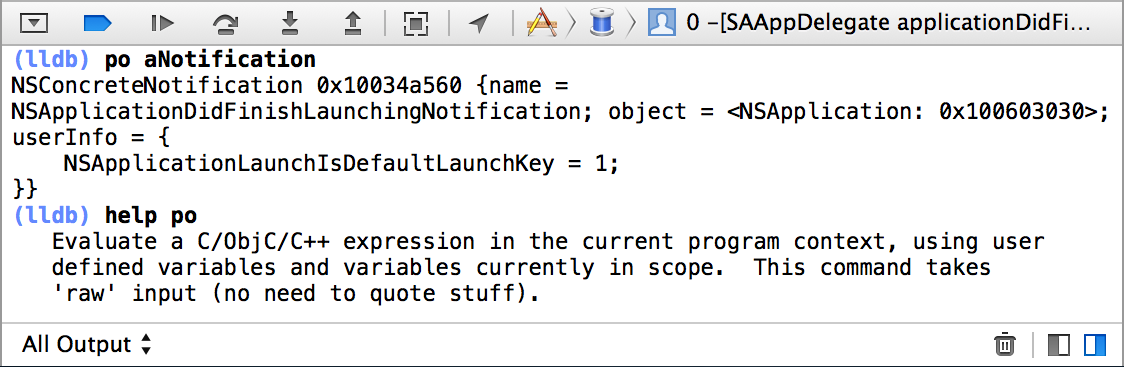
本文重點整理 LLDB 提供的常用調試命令,更詳細的內容可參考 The LLDB Debugger。
LLDB 命令結構
在使用 LLDB 前,我們需要了解它的命令結構與語法,以盡可能挖掘其潛能。LLDB 命令的通用結構通常如下:
[ [ ...]] [-options [option-value]] [argument [argument...]]
其中:
(lldb) command [subcommand] -option "some \"quoted\" string" (lldb) command [subcommand] -option 'some "quoted" string'
這種解析設計規範並統一了 LLDB 的命令語法。
命令選項
LLDB 命令選項有規範形式與縮寫形式兩種。以設置斷點的 breakpoint set 為例:
breakpoint set -M( --method ) -S ( --selector ) -b ( --basename ) -f ( --file ) -l ( --line ) -n ( --name ) …
各選項順序任意。若後面參數以「–」開頭,可在選項後加「—」作為終止信號:
(lldb) process launch --stop-at-entry -- -program_arg_1 value -program_arg_2 value
如上,命令選項是 --stop-at-entry,參數是 -program_arg_1 與 -program_arg_2,我們用「—」將兩者區分開。
原始命令
LLDB 命令解析器支持「原始(raw)」命令,即沒有命令選項、剩餘部分未經解析就傳給命令,例如 expression 就是原始命令。原始命令也可以有選項,若命令字符串含虛線,可在命令名與字符串間放一個「—」表示沒有命令標記。我們可透過 help 命令的輸出判斷一個命令是否為原始命令。
命令補全
LLDB 支持源文件名、符號名、文件名等的命令補全。終端中的補全透過在命令行輸入製表符初始化;Xcode 控制台中的補全與源碼編輯器一致:在鍵入第三個字符時自動彈出,或按 Esc 手動彈出。同一命令中的私有選項可有不同完成者,例如 breakpoint 的 --file 作為源文件完成者、--shlib 作為當前加載庫的完成者。
Python 腳本
對高級用戶而言,LLDB 內置了 Python 解析器,可透過腳本命令訪問,調試器中的所有特性在 Python 中都可作為類訪問。這樣我們就能用 LLDB-Python 庫寫 Python 函數,並透過腳本加載到運行會話中,執行更複雜的調試操作。
在命令行中調試程序
通常我們直接在 Xcode 中使用 LLDB,它能幫我們完成很多操作。若想深入了解調試器流程,可以試著在終端用 LLDB 命令調試。需要了解:加載程序、將運行中的程序綁定到 LLDB、設置斷點與觀察點、控制執行、在調試程序中導航、檢查狀態與變量、執行替代代碼。
指定要調試的程序
可用以下命令設置待調試程序:
$ lldb /Projects/Sketch/build/Debug/Sketch.app Current executable set to '/Projects/Sketch/build/Debug/Sketch.app' (x86_64).
或在運行 lldb 後用 file 命令:
$ lldb (lldb) file /Projects/Sketch/build/Debug/Sketch.app Current executable set to '/Projects/Sketch/build/Debug/Sketch.app' (x86_64).
設置斷點
用 breakpoint set 設置斷點,簡單直觀且有智能補全。在某文件某行設斷點:
(lldb) breakpoint set --file foo.c --line 12
給某函數設斷點:
(lldb) breakpoint set --name foo
給 C++ 中所有名為 foo 的方法設斷點:
(lldb) breakpoint set --method foo
給 Objective-C 中所有名為 alignLeftEdges: 的選擇器設斷點:
(lldb) breakpoint set --selector alignLeftEdges:
用 --shlib 可把斷點限定在特定可執行庫中:
(lldb) breakpoint set --shlib foo.dylib --name foo
查看所有斷點用 breakpoint list:
(lldb) breakpoint list Current breakpoints: 1: name = 'alignLeftEdges:', locations = 1, resolved = 1 1.1: where = Sketch`-[SKTGraphicView alignLeftEdges:] + 33 at /Projects/Sketch/SKTGraphicView.m:1405, address = 0x0000000100010d5b, resolved, hit count = 0
從輸出可見,一個斷點通常有兩部分:一是斷點的邏輯規範(用戶提供給 breakpoint set 的),二是與規範匹配的位置。breakpoint list 中每個邏輯斷點有一個整數標識(如 1),每個位置也有標識(如 1.1)。輸出中的「resolved」表示相關文件位址加載到程序時該位置是否已解析;若共享庫被卸載,斷點位置仍保留但不能再解析。我們可用斷點觸發命令對其刪除、禁用、設條件或忽略計數。例如想在命中 1.1 時打印跟蹤棧:
(lldb) breakpoint command add 1.1 Enter your debugger command(s). Type 'DONE' to end. > bt > DONE
設置觀察點
作為斷點的補充,LLDB 支持觀察點以在不中斷運行的情況下監測變量。例如監測名為 global 的變量的寫操作,並在 (global==5) 為真時停止:
(lldb) watch set var global Watchpoint created: Watchpoint 1: addr = 0x100001018 size = 4 state = enabled type = w declare @ '/Volumes/data/lldb/svn/ToT/test/functionalities/watchpoint/watchpoint_commands/condition/main.cpp:12' (lldb) watch modify -c '(global==5)' (lldb) watch list Current watchpoints: Watchpoint 1: addr = 0x100001018 size = 4 state = enabled type = w declare @ '/Volumes/data/lldb/svn/ToT/test/functionalities/watchpoint/watchpoint_commands/condition/main.cpp:12' condition = '(global==5)' (lldb) c Process 15562 resuming (lldb) about to write to 'global'... Process 15562 stopped and was programmatically restarted. Process 15562 stopped and was programmatically restarted. Process 15562 stopped and was programmatically restarted. Process 15562 stopped and was programmatically restarted. Process 15562 stopped * thread #1: tid = 0x1c03, 0x0000000100000ef5 a.out`modify + 21 at main.cpp:16, stop reason = watchpoint 1 frame #0: 0x0000000100000ef5 a.out`modify + 21 at main.cpp:16 13 14 static void modify(int32_t &var) { 15 ++var; -> 16 } 17 18 int main(int argc, char** argv) { 19 int local = 0; (lldb) bt * thread #1: tid = 0x1c03, 0x0000000100000ef5 a.out`modify + 21 at main.cpp:16, stop reason = watchpoint 1 frame #0: 0x0000000100000ef5 a.out`modify + 21 at main.cpp:16 frame #1: 0x0000000100000eac a.out`main + 108 at main.cpp:25 frame #2: 0x00007fff8ac9c7e1 libdyld.dylib`start + 1 (lldb) frame var global (int32_t) global = 5 (lldb) watch list -v Current watchpoints: Watchpoint 1: addr = 0x100001018 size = 4 state = enabled type = w declare @ '/Volumes/data/lldb/svn/ToT/test/functionalities/watchpoint/watchpoint_commands/condition/main.cpp:12' condition = '(global==5)' hw_index = 0 hit_count = 5 ignore_count = 0 (lldb)可用 help watchpoint 查看該命令用法。
啟動程序
設置好斷點後即可啟動程序:
(lldb) process launch (lldb) run (lldb) r
也可用進程 ID 或名稱連接已運行的程序,用名稱連接時支持 --waitfor(等待下一個該名稱的程序出現再連接):
(lldb) process attach --pid 123 (lldb) process attach --name Sketch (lldb) process attach --name Sketch --waitfor
啟動或連接後,進程可能因信號等原因停止。注意「1 of 3 threads stopped with reasons:」——在多執行緒環境下,內核實際返回控制權前可能有多個執行緒命中同一斷點,此時停止信息會列出所有因此停止的執行緒。
控制程序
LLDB 的流程控制命令都在 thread 命令層級下:
(lldb) thread continue Resuming thread 0x2c03 in process 46915 Resuming process 46915
還有:
(lldb) thread step-in // The same as "step" or "s" in GDB. (lldb) thread step-over // The same as "next" or "n" in GDB. (lldb) thread step-out // The same as "finish" or "f" in GDB. (lldb) thread step-inst // The same as "stepi" / "si" in GDB. (lldb) thread step-over-inst // The same as "nexti" / "ni" in GDB.
LLDB 還提供 thread until 模式:
lldb) thread until 100
它會運行線程直到當前 frame 到達第 100 行;若運行中跳過了第 100 行,則在 frame 彈出棧後終止。
查看線程狀態
進程停止後,LLDB 會選一個當前線程與當前幀。用 thread list 檢測進程狀態:
(lldb) thread list Process 46915 state is Stopped * thread #1: tid = 0x2c03, 0x00007fff85cac76a, where = libSystem.B.dylib`__getdirentries64 + 10, stop reason = signal = SIGSTOP, queue = com.apple.main-thread thread #2: tid = 0x2e03, 0x00007fff85cbb08a, where = libSystem.B.dylib`kevent + 10, queue = com.apple.libdispatch-manager thread #3: tid = 0x2f03, 0x00007fff85cbbeaa, where = libSystem.B.dylib`__workq_kernreturn + 10
星號(*)表示 thread #1 為當前線程。用 thread backtrace 取得跟蹤棧:
(lldb) thread backtrace thread #1: tid = 0x2c03, stop reason = breakpoint 1.1, queue = com.apple.main-thread frame #0: 0x0000000100010d5b, where = Sketch`-[SKTGraphicView alignLeftEdges:] + 33 at /Projects/Sketch/SKTGraphicView.m:1405 frame #1: 0x00007fff8602d152, where = AppKit`-[NSApplication sendAction:to:from:] + 95 frame #2: 0x00007fff860516be, where = AppKit`-[NSMenuItem _corePerformAction] + 365 frame #3: 0x00007fff86051428, where = AppKit`-[NSCarbonMenuImpl performActionWithHighlightingForItemAtIndex:] + 121 frame #4: 0x00007fff860370c1, where = AppKit`-[NSMenu performKeyEquivalent:] + 272 frame #5: 0x00007fff86035e69, where = AppKit`-[NSApplication _handleKeyEquivalent:] + 559 frame #6: 0x00007fff85f06aa1, where = AppKit`-[NSApplication sendEvent:] + 3630 frame #7: 0x00007fff85e9d922, where = AppKit`-[NSApplication run] + 474 frame #8: 0x00007fff85e965f8, where = AppKit`NSApplicationMain + 364 frame #9: 0x0000000100015ae3, where = Sketch`main + 33 at /Projects/Sketch/SKTMain.m:11 frame #10: 0x0000000100000f20, where = Sketch`start + 52
查看所有線程調用棧用 thread backtrace all。
檢查幀參數與本地變量最簡便的方式是 frame variable:
(lldb) frame variable self = (SKTGraphicView *) 0x0000000100208b40 _cmd = (struct objc_selector *) 0x000000010001bae1 sender = (id) 0x00000001001264e0 selection = (NSArray *) 0x00000001001264e0 i = (NSUInteger) 0x00000001001264e0 c = (NSUInteger) 0x00000001001253b0
不指定變量名時會顯示所有參數與本地變量;指定時只打印該值。它雖非完整的表達式解析器,但支持 &、*、->、[] 等簡單操作符,其中數組括號可把指針當數組處理。它還會對變量執行「對象打印」,目前支持 Objective-C 的 description 方法。若想查看另一幀,用 frame select:
(lldb) frame select 9 frame #9: 0x0000000100015ae3, where = Sketch`function1 + 33 at /Projects/Sketch/SKTFunctions.m:11
在 Xcode 中調試程序
日常開發中,我們更多在 Xcode 裡調試,上述流程 Xcode 已幫我們完成大部分,很多資訊也能直接看到,因此我們可以把精力集中在代碼層面。下面重點講一些常用命令。
打印
用 print 打印變量的值,簡單類型會列出類型與值,對象還會打印指針地址:
(lldb) print a (NSInteger) $0 = 0 (lldb) print b (NSInteger) $1 = 0 (lldb) print str (NSString *) $2 = 0x0000000100001048 @"abc" (lldb) print url (NSURL *) $3 = 0x0000000100206cc0 @"abc"
輸出中的 $0、$1 可視為指向對象的參照,存在於 LLDB 的全名空間中,便於輔助調試,且數值隨每次打印遞增:
(lldb) exp $0 = 100 (NSInteger) $9 = 100 (lldb) p a (NSInteger) $10 = 100
若只想查看對象的值,用 po(print object 的縮寫):
(lldb) po str abc
po 其實是「exp -O —」的別名。對簡單類型還可指定不同打印格式,命令格式為 print/:
(lldb) p/x a (NSInteger) $13 = 0x0000000000000064
expression
我們常遇到這樣的情況:設置視圖背景色後發現不好看,改代碼、重新編譯運行、又不對……浪費大量時間。此時 expression 命令的強大之處就體現出來了——它不僅改變調試器中的值,還改變程序中的實際值:
(lldb) exp a = 10 (NSInteger) $0 = 10 (lldb) exp b = 100 (NSInteger) $1 = 100 2015-01-25 14:00:41.313 test[18064:71466] a + b = 110, abc
expression 的功能不僅於此,正如 po 也是「expression -O —」的別名,更詳細用法可參考 Evaluating Expressions。
image
image 命令用途頗多。首先可查看工程使用的庫:
(lldb) image list [ 0] 432A6EBF-B9D2-3850-BCB2-821B9E62B1E0 0x0000000100000000 /Users/**/Library/Developer/Xcode/DerivedData/test-byjqwkhxixddxudlnvqhrfughkra/Build/Products/Debug/test [ 1] 65DCCB06-339C-3E25-9702-600A28291D0E 0x00007fff5fc00000 /usr/lib/dyld [ 2] E3746EDD-DFB1-3ECB-88ED-A91AC0EF3AAA 0x00007fff8d324000 /System/Library/Frameworks/Foundation.framework/Versions/C/Foundation [ 3] 759E155D-BC42-3D4E-869B-6F57D477177C 0x00007fff8869f000 /usr/lib/libobjc.A.dylib [ 4] 5C161F1A-93BA-3221-A31D-F86222005B1B 0x00007fff8c75c000 /usr/lib/libSystem.B.dylib [ 5] CBD1591C-405E-376E-87E9-B264610EBF49 0x00007fff8df0d000 /System/Library/Frameworks/CoreFoundation.framework/Versions/A/CoreFoundation [ 6] A260789B-D4D8-316A-9490-254767B8A5F1 0x00007fff8de36000 /usr/lib/libauto.dylib ......
還可用它查找可執行檔或共享庫的原始位址——當程序崩潰時,可用它定位崩潰位置。例如以下代碼會越界:
NSArray *array = @[@1, @2]; NSLog(@"item 3: %@", array[2]);
運行後拋出 NSRangeException,並列出具體調用棧。判斷崩潰在 main.m 後,想知道具體行號可用:
(lldb) image lookup --address 0x0000000100000de0 Address: test[0x0000000100000de0] (test.__TEXT.__text + 384) Summary: test`main + 384 at main.m:23
可見它精準定位到了 main.m 第 23 行。我們還可用 image lookup 查看具體類型:
(lldb) image lookup --type NSURL Best match found in /Users/**/Library/Developer/Xcode/DerivedData/test-byjqwkhxixddxudlnvqhrfughkra/Build/Products/Debug/test: id = {0x100000157}, name = "NSURL", byte-size = 40, decl = NSURL.h:17, clang_type = "@interface NSURL : NSObject{ ... } ... @end"輸出中列出了 NSURL 的成員變量與屬性資訊。image 命令還有許多其他功能,可參考 Executable and Shared Library Query Commands。
流程控制
流程控制命令在上一節已講過,在 Xcode 控制面板中同樣可用,此處不再重複。
命令別名與幫助系統
命令別名
我們可用別名機制為常用命令取個短名:
(lldb) breakpoint set --file foo.c --line 12
若經常用到這串命令,可建立別名:
(lldb) command alias bfl breakpoint set -f %1 -l %2
之後只需:
(lldb) bfl foo.c 12
是不是簡單多了?LLDB 啟動時會讀取 ~/.lldbinit 文件,其中存儲了 command alias 建立的別名,可用「help -a」查看。若不喜歡某別名,可用 command unalias 取消:
(lldb) command unalias b
幫助系統
LLDB 的幫助系統讓我們了解它提供了哪些功能,並查看命令結構的詳細資訊。直接呼叫 help 可列出所有頂層命令;help 後跟特定命令則列出該命令的所有資訊,以 breakpoint set 為例:
(lldb) help breakpoint set Sets a breakpoint or set of breakpoints in the executable. Syntax: breakpoint setCommand Options Usage: breakpoint set [-Ho] -l [-s ] ... … and so forth …
還有一種更直接的方式——apropos 命令,它會依關鍵字搜索幫助文檔,並為每個命令選取一個幫助字符串:
(lldb) apropos file The following commands may relate to 'file': … log enable -- Enable logging for a single log channel. memory read -- Read from the memory of the process being debugged. source -- A set of commands for accessing source file information … and so forth …
我們還可用 help 了解命令別名的構成,例如 help b 會顯示「'b' is an abbreviation for '_regexp-break'」。此外,help 還能查看某個具體參數的作用——把參數放在尖括號內即可,如 help <breakpt-id> 會說明「Breakpoint IDs consist major and minor numbers…」。幫助系統能讓我們快速掌握命令用法,建議多多使用。
總結
LLDB 帶來了強大的調試能力,充分善用它能大幅提升調試效率,讓你不必再寫一大堆 NSLog 來打印日誌。上述命令只是 LLDB 的冰山一角,更多玩法還需自行發掘,本文拋磚引玉,做了一些整理。
參考
The LLDB Debugger、LLDB Quick Start Guide、與調試器共舞 – LLDB 的華爾茲、LLDB 調試命令初探、NSLog 效率低下的原因及嘗試 lldb 斷點打印 Log。
- 上一篇文章: 源碼推薦精選:一週實用 iOS 組件合集
- 下一篇文章: Apple Pay 開發實戰指南:從環境配置到支付入帳